My reports take too much manual work
Automate recurring Excel, Power BI or management reports.
Expected outcome: Less repetitive work and a repeatable reporting process.Explore solutionData analytics · Power BI · Automation
I help European businesses organise their data, automate reporting and use analytics or practical AI to make better business decisions.
Which metrics matter
Why performance changed
What can be automated
Start with the business problem
Automate recurring Excel, Power BI or management reports.
Expected outcome: Less repetitive work and a repeatable reporting process.Explore solutionBring Excel, CSV, SQL, SharePoint, APIs and structured files into one reporting flow.
Expected outcome: One reliable view of the information you need.Explore solutionAnalyse revenue, customers, operations or performance to find the main drivers.
Expected outcome: A clear explanation and practical next questions.Explore solutionReview data models, Power Query logic, duplicate data and DAX calculations.
Expected outcome: A faster, more reliable dashboard.Explore solutionBuild a focused dashboard around the KPIs used in daily decisions.
Expected outcome: A clear view without unnecessary charts.Explore solutionUse practical automation or AI where it reduces predictable manual work.
Expected outcome: A simpler workflow with human review where needed.Explore solutionServices explained by outcome
Clean data, analyse trends, investigate business questions and create actionable reports.
Build or improve dashboards, semantic models, Power Query logic and DAX calculations.
Replace repetitive reporting steps with a clear, repeatable process using the right tools.
Explore practical AI assistants and automations for documents, knowledge and repetitive tasks.
Examples, not client claims
Evidence-based trust
I explain technical work in simple business language.
Every project follows agreed steps and deliverables.
The goal is to answer useful questions, not only create charts.
Your data is used only for the agreed project purpose.
Important calculations and data flows can be documented.
We can start with a small pilot before expanding.
European data handling
Specific security and hosting requirements can be agreed before the project begins.
Selected work
Interactive reporting built for clear, faster decisions.
An interactive analysis of IPL ball-by-ball data, revealing top batsmen and bowlers, run patterns, wickets, venues, seasons, innings, and team performance.
A practical EHS overview that tracks incidents by department and region, severity, training completion, and compliance failures for faster safety decisions.
A decision-focused report comparing YTD with prior-year performance across countries, products, accounts, gross profit, and monthly trends.
An exploratory performance report with country rankings, waterfall analysis, product trends, account-level profitability, and dynamic metric selection.
A clean retail KPI view designed to monitor total sales, order quantities, delivery days, and year-based performance at a glance.
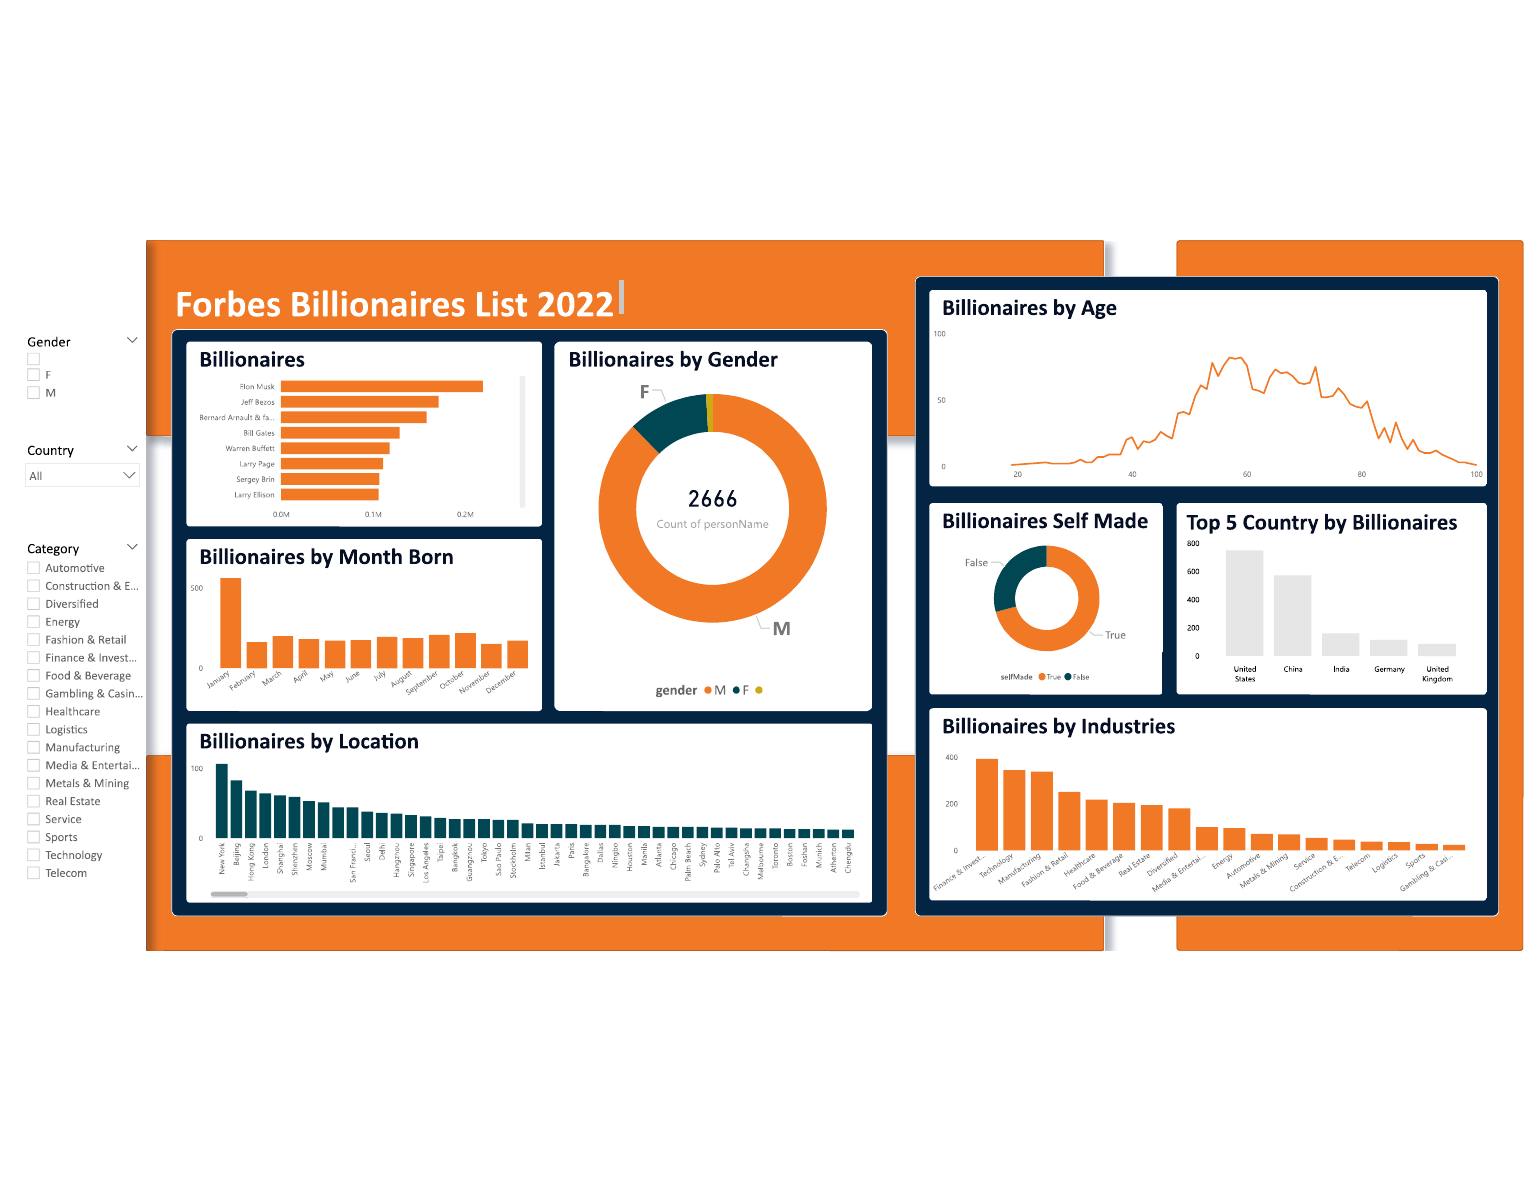
A visual study of 2,666 billionaires across age, gender, country, industry, location, self-made status, and month of birth.
Statistical foundations, predictive models, and end-to-end ML systems.
A from-the-ground-up study of linear relationships, covering preprocessing, feature scaling, coefficient interpretation, training, prediction, and model evaluation.
A structured workflow for cleaning data, handling missing values and outliers, exploring distributions, measuring correlations, and revealing patterns through visual analysis.
Practical implementations of probability distributions, confidence intervals, hypothesis tests, correlation, and statistical inference for data-science decisions.
A reusable machine-learning workflow spanning data acquisition, preprocessing, feature engineering, model selection, tuning, evaluation, and reproducible delivery.
An experimental AI project exploring advanced learning techniques and how intelligent algorithms can be applied to complex real-world problems.
A predictive safety system that learns from historical incident data to classify severity, support response prioritization, and strengthen preventive risk management.
Text intelligence and assistants that turn language into useful action.
An NLP workflow that preprocesses and vectorizes text, then classifies feedback as positive, negative, or neutral and evaluates model performance.
How can I help?
Track my order
Here’s the latest update.
An intelligent assistant designed to answer routine customer questions, use FAQ and conversation knowledge, and route more complex requests to people.
A 24/7 employee assistant for HR and EHS questions, onboarding, policies, benefits, training, safety procedures, and workplace guidance.
A focused front-end chat experience with message history, user input, and conversation flow—the presentation layer for web-based assistant systems.
Service
Quality
Price
A deeper text-analysis project that identifies opinions about specific entities, features, and topics to explain not only sentiment, but the reasons behind it.
Clear before work begins
You describe the current situation, available data and desired outcome.
I check the data, systems and likely limitations.
We agree on scope, output, timeline and required access.
I develop the analysis, dashboard or automation and validate the results.
You receive the finished solution with agreed documentation or explanation.
For larger projects, we can start with a small pilot first.
About
Data analytics, Power BI, reporting automation and practical AI workflows.
I start with the business problem, prefer simple solutions over unnecessary complexity and define the expected output before building.
Remote collaboration, clear scope, transparent communication, documentation and privacy-conscious data handling.
View LinkedIn profileUseful resources
Common model, query and visual causes to check first.
Read guideA practical way to map repetitive reporting steps before choosing a tool.
Read guideA simple method for choosing decision-useful KPIs.
Read guideThe site is prepared for practical resources such as a Power BI audit checklist, KPI checklist and reporting automation calculator.
Practical questions
Yes. Existing reports, Power Query logic, data models and calculations can be reviewed and improved.
No. Data cleaning and restructuring can be part of the project.
Yes, when required.
Yes. A focused pilot is often a practical way to validate the solution before expanding.
Excel, CSV, SQL databases, SharePoint, Power BI data sources, APIs and structured business files.
Yes. I work remotely from the Europe/Berlin time zone.
Yes, when recurring reporting, dashboard maintenance or analytics support is part of the agreed scope.
Low-friction first step
You don’t need to know the technical solution. Describe what is currently difficult, manual or unclear, and I will review the problem.