Regression analysis is a statistical method used to examine the relationship between two or more variables. It is a powerful tool for predicting future outcomes based on past data. There are two main types of regression analysis: simple linear regression and multiple linear regression. In this article, we will explore the differences between these two methods, using examples to illustrate the key concepts.
Simple Linear Regression
Simple linear regression is a statistical technique used to model the relationship between two variables: a dependent variable and an independent variable. The dependent variable is the variable we want to predict, while the independent variable is the variable that we use to make the prediction. In simple linear regression, we assume that there is a linear relationship between the two variables, which means that the change in the independent variable is directly proportional to the change in the dependent variable.
For example, let’s say we want to predict a person’s weight based on their height. In this case, weight is the dependent variable, and height is the independent variable. We would collect data on the heights and weights of a sample of individuals and use this data to create a regression model. The model would allow us to predict a person’s weight based on their height.
The equation for a simple linear regression model is:
Y = a + bX + e
where Y is the dependent variable, X is the independent variable, a is the intercept (the value of Y when X = 0), b is the slope (the change in Y for a one-unit change in X), and e is the error term (the difference between the predicted value of Y and the actual value of Y).
Multiple Linear Regression
Multiple linear regression is a statistical technique used to model the relationship between two or more independent variables and a dependent variable. The idea behind multiple linear regression is similar to simple linear regression, except that we now have multiple independent variables that we use to make our prediction.
For example, let’s say we want to predict a person’s salary based on their age, education, and years of experience. In this case, salary is the dependent variable, while age, education, and years of experience are the independent variables. We would collect data on these variables for a sample of individuals and use this data to create a regression model. The model would allow us to predict a person’s salary based on their age, education, and years of experience.
The equation for a multiple linear regression model is:
Y = a + b1X1 + b2X2 + b3X3 + … + bnXn + e
Where Y is the dependent variable, X1, X2, X3, … Xn are the independent variables, a is the intercept, b1, b2, b3,… bn are the slopes (the change in Y for a one-unit change in each independent variable), and e is the error term.
Differences between Simple Linear Regression and Multiple Linear Regression
The main difference between simple linear regression and multiple linear regression is the number of independent variables used in the model. In simple linear regression, we use one independent variable, while in multiple linear regression, we use two or more independent variables.
Another difference is the complexity of the model. Simple linear regression models are relatively simple and easy to interpret, as they involve only two variables. Multiple linear regression models, on the other hand, are more complex and require more computational power. They also require more careful interpretation, as the relationships between the independent variables and the dependent variable can be more difficult to understand.
Example
To illustrate the differences between simple linear regression and multiple linear regression, let’s consider an example. Suppose we want to predict a person’s score on a math test based on their study time and their IQ score. We collect data on study time (in hours) and IQ scores (on a scale of 0 to 100) for a sample of 50 students, along with their scores on a math test (out of 100). We can then use this data to create both a simple linear regression model and a multiple linear regression model.
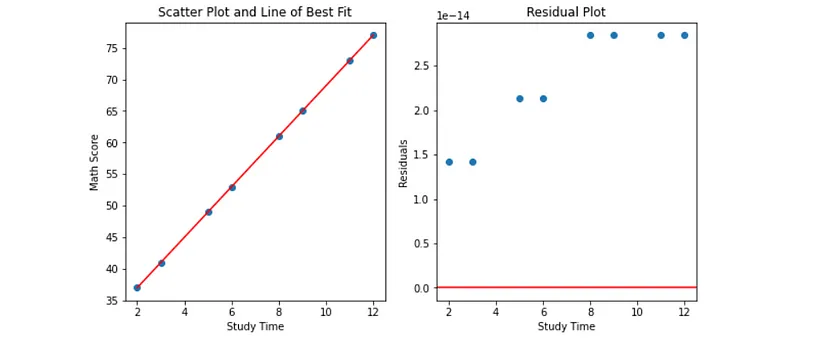
First, let’s create a simple linear regression model. We can plot the data on a scatter plot to visualize the relationship between study time and math scores.

From the scatter plot, we can see that there appears to be a positive linear relationship between study time and math scores. We can then fit a linear regression line to the data to estimate the relationship between the two variables.
The equation for the simple linear regression model is:
Math Score = 32.55 + 1.89 x Study Time
This means that for every one-hour increase in study time, we expect the student’s math score to increase by 1.89 points, on average.
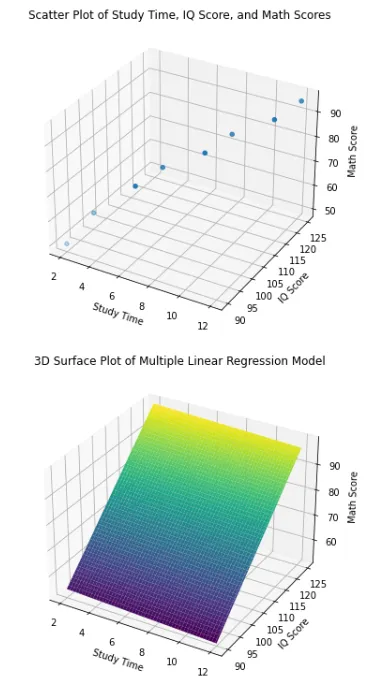
Now, let’s create a multiple linear regression model that includes both study time and IQ score as independent variables. The equation for the multiple linear regression model is:
Math Score = 17.62 + 1.68 x Study Time + 0.26 x IQ Score

This means that for every one-hour increase in study time, we expect the student’s math score to increase by 1.68 points, on average, holding the IQ score constant. Similarly, for every one-point increase in IQ score, we expect the student’s math score to increase by 0.26 points, on average, holding study time constant.
Interpreting the Results
From the simple linear regression model, we can conclude that study time has a significant positive effect on math scores. However, we cannot determine whether IQ scores have a significant effect on math scores or not. This is because the simple linear regression model only includes one independent variable.
From the multiple linear regression model, we can conclude that both study time and IQ score have significant positive effects on math scores. This means that students who study more and have higher IQ scores are likely to have higher math scores.
However, we should note that the relationship between study time and math scores is weaker in the multiple linear regression model than in the simple linear regression model. This is because the effect of study time is partially explained by IQ score in the multiple linear regression model.
Conclusion
In conclusion, both simple linear regression and multiple linear regression are powerful tools for predicting outcomes based on past data. Simple linear regression is used when we want to predict a dependent variable based on a single independent variable, while multiple linear regression is used when we want to predict a dependent variable based on two or more independent variables. While simple linear regression models are relatively simple and easy to interpret, multiple linear regression models are more complex and require more computational power. Additionally, the relationships between the independent variables and the dependent variable can be more difficult to understand in multiple linear regression models. Overall, the choice between simple linear regression and multiple linear regression depends on the specific research question and the nature of the data being analyzed.